playground / computer vision / medical imaging
Brain Tumor Segmentation & Classification
U-Net segments the tumor, DenseNet-121 names it. Page through real inference on unseen MRI slices.
- test dice
- 88.22%
- U-Net segmentation
- mIoU
- 79.74%
- U-Net
- pixel acc
- 99.61%
- U-Net
- classification
- 97.50%
- DenseNet-121
- dataset
- BRISC 2025
- / 6,000 T1 MRI slices, 4 classes
- test set
- 860
- / unseen samples
- hardware
- RTX 3070
- / 8GB, PyTorch 2.0 + CUDA 11.8
- inference
- ~45 ms
- / per slice
interactive / live in your browser
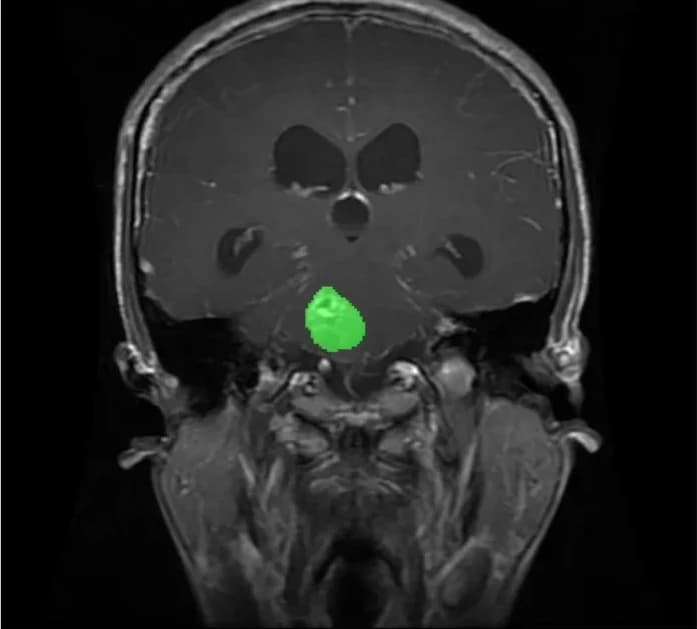
iThese are authentic saved outputs from the trained U-Net and DenseNet-121. Segmentation IoU is shown for test-set slices that carry ground-truth masks.
classifier output
- seg IoU
- 81.37%
- ground truth
- Glioma
Test slice with ground truth; strong overlap.
curated examples
the pipeline
From raw data to a verifiable result
- 01 / dataset
BRISC 2025 MRI
T1-weighted brain MRI at 256x256, spanning glioma, meningioma, pituitary, and no-tumor. 3,933 valid image-mask pairs drive the segmentation task.
5,000 train / 1,000 test256x256 grayscale4 tumor categories - 02 / augmentation
Aggressive augmentation
Horizontal and vertical flips, rotation up to 15 degrees, affine transforms, brightness/contrast jitter, and Gaussian noise expand the modest dataset without distorting anatomy.
- 03 / architecture
U-Net + DenseNet-121
A five-level U-Net with skip connections handles segmentation under a combined Dice-BCE loss. A separate DenseNet-121 classifies the slice. Separate models beat a shared encoder here.
U-Net: dice-bce lossDenseNet: cross-entropytrained separately - 04 / training
100 epochs, early stopping
Adam at 1e-4, batch size 16, up to 100 epochs with patience 15. A 20-run grid confirmed Adam at 5e-5 as optimal across optimizers.
- 05 / evaluation
860 unseen samples
U-Net won all four segmentation metrics against Attention U-Net. Test performance exceeded validation by ~5 points, evidence of robust training rather than overfitting.
- 06 / inference
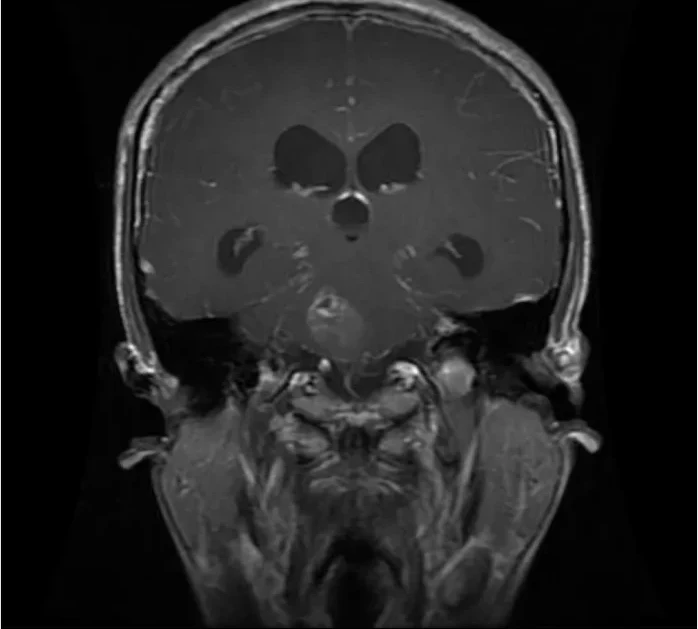
Original to prediction
Below: real inference panels. Drag the slider to wipe between the input MRI and the model's predicted tumor overlay, and read the classifier's call and confidence.
evaluation artifacts